
Introduction
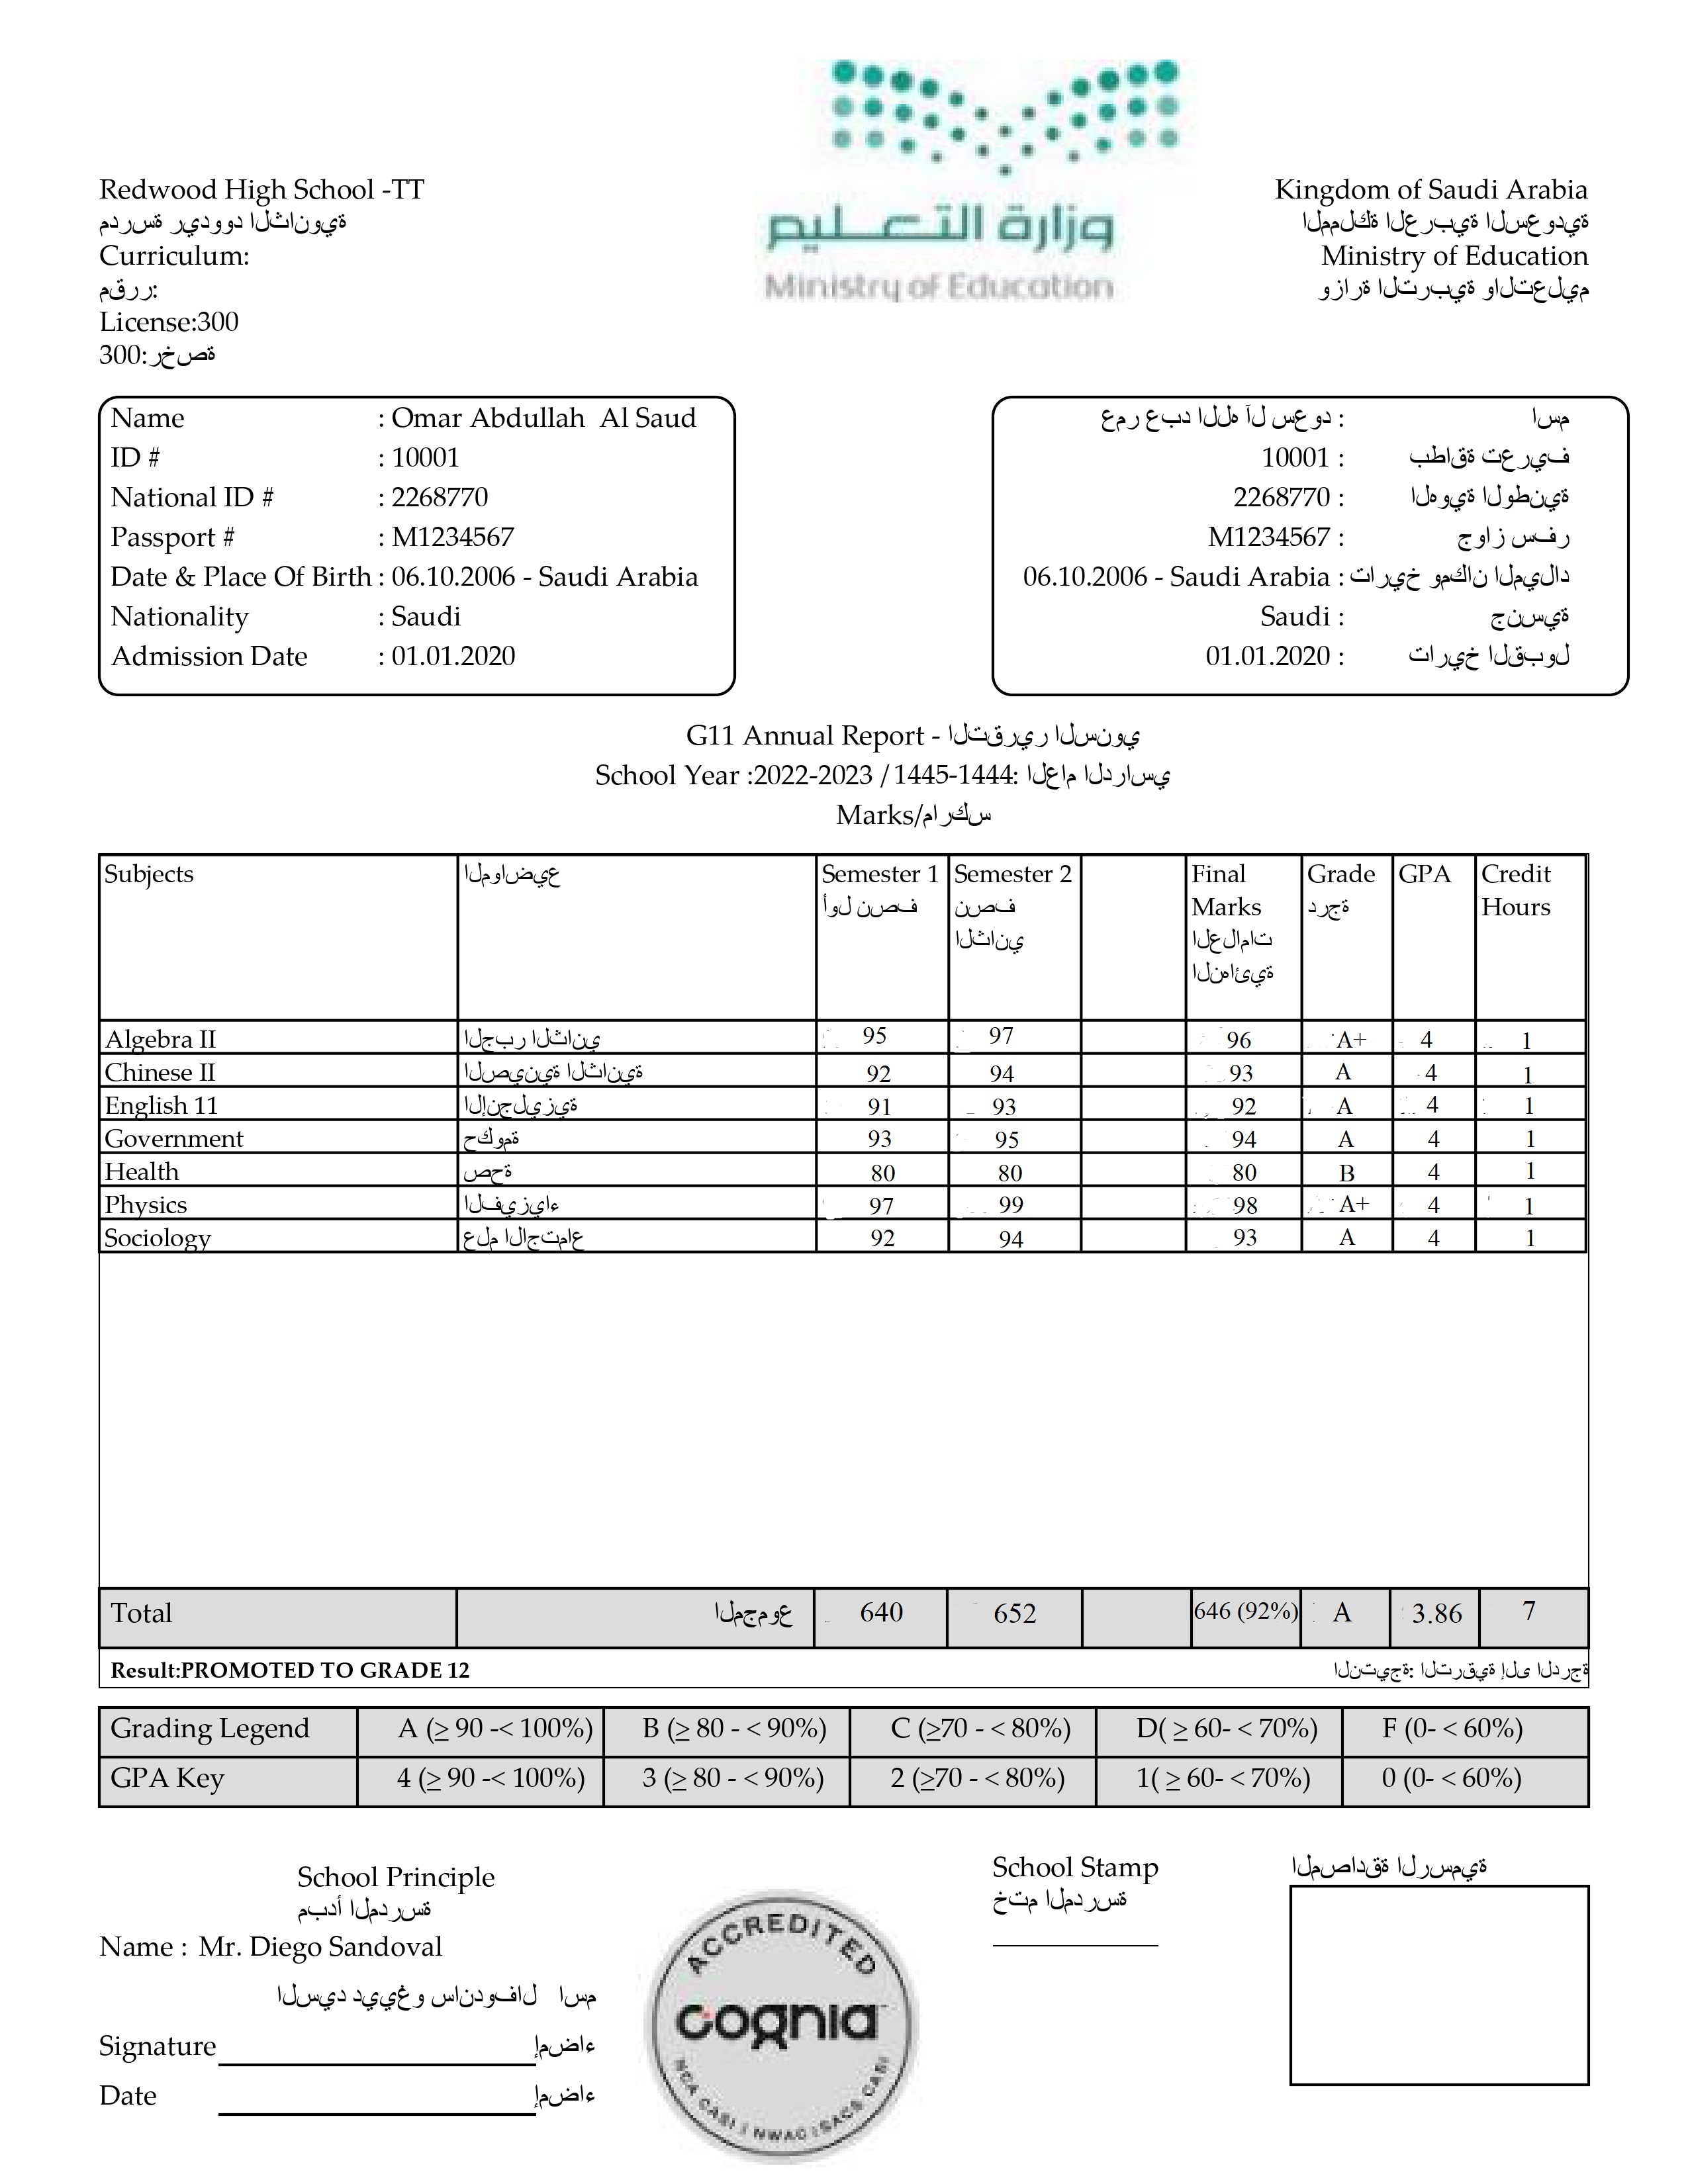
The following image is a sample student report card summarizing academic performance for a specific school year. It includes:
-
Basic Student Information: Name, date of birth, nationality, National ID, passport number, and admission date.
-
Academic Performance: A list of subjects with semester marks, final grades, GPA, and credit hours for each course.
-
Grading System: A legend explaining letter grades based on percentage ranges.
-
Final Outcome: Displays total marks and indicates the student's promotion to the next grade.
-
Official Approval: Contains a school stamp and the principal's signature to validate the report.
The report card is presented in both English and Arabic.
Design Summary
The design of the report card follows a structured and formal layout, with a mix of English and Arabic text. Here’s a design breakdown:
-
Student Information Section:
-
Contains key personal details (name, date of birth, nationality, admission date) aligned for clarity and quick reference.
-
-
School Information:
-
Displays the school’s name, curriculum information, and school license number.
-
-
Subject and Grades Table:
-
A well-organized table lists the student’s subjects, semester marks, final grades, GPA, and credit hours.
-
Bilingual subject titles (English and Arabic) are used to enhance accessibility.
-
-
Grading Legend:
-
A grading scale, detailing percentage ranges for letter grades (A, B, C, etc.), appears at the bottom for clarity.
-
-
Footer and Authentication:
-
Includes a school stamp and principal’s signature, confirming the report’s authenticity.
-
The design focuses on clarity, accuracy, and bilingual presentation.
Implementation
1. Data Extraction with Power Query DATs
Use Power Query DATs to pull data from PowerSchool’s database. Here's a breakdown:
-
Student Information: Name, ID, date of birth, nationality, admission date.
-
Course Information: Subject names, credit hours, curriculum information.
-
Academic Performance: Semester grades, final grades, GPA, and total marks.
Example Power Query DATs:
-
School Name:
~([39]Name) -
National ID:
~(State_Studentnumber) -
Passport Number:
~(s_sau_stu_x.PassportNumber) -
Date of Birth:
~(DOB)
For more DATs, refer to Saudi Arabia Localization 24.9.0.0 - Power Query DATs Report Section
2. Creating an Object Report
Object Reports in PowerSchool allow you to format and display data retrieved by Power Query DATs. Follow these steps for implementation:
Setting up the Report Layout:
-
Object Report Layout Construction: To Know more about constructing layouts using object reports, please refer to this guide. https://ps.powerschool-docs.com/pssis-admin/latest/object-reports
-
Logo insertion: To add an image to an object report, navigate to System Management → Reports → Pictures for Object Report and upload the required images. These images will be available when creating the report layout, allowing you to place the object picture with the desired alignments. For more information, please refer to this section https://ps.powerschool-docs.com/pssis-admin/latest/objects-on-an-object-report#id-(24.12)ObjectsonanObjectReport-ReportPictures
-
Header Section: This section will display the school’s name, logo, and report card title. Use text objects and add Power Query DATs to display school information dynamically
-
Student Information: Create text fields and placeholders to show the student’s name, ID, date of birth, and other personal details
-
Subject and Grades Table: Add a table for subjects, semester marks, GPA, and credit hours using Power Query DATs:
<table border="1"><tr><th width="130">Subjects</th><th width="130">المواضيع
</th><th width="48">~(*powerquery;query=com.powerschool.common.dat.reportcard;arg.gradesystem=S1;fields=header1)</th><th width="48">~(*powerquery;query=com.powerschool.common.dat.reportcard;arg.gradesystem=S2;fields=header1)</th><th width="38">~(*powerquery;query=com.powerschool.common.dat.reportcard;arg.gradesystem=S3;fields=header1)</th><th width="42">Final Marks العلامات النهائية
</th><th width="33">Grade درجة
</th><th width="30">GPA</th><th width="36">Credit Hours</th></tr>^(*powerquery;query=com.powerschool.common.dat.gradescore;tableformat;fields=coursename,altcoursename,gradepercent1,gradepercent2,gradepercent3,yearly,yearlygrade,gpapoints,credithrs;arg.gradesystem=S1|S2|S3)</table>
3. Incorporating GPA Calculations
we have used the power query dat to get Totals for each semester, final Marks GPA, grades, and credit hours
|
Fields in Sample Report |
DAT’s |
|---|---|
|
Semister 1 Total |
^(*powerquery;query=com.powerschool.common.dat.gradescoresum;fields=gradepercent1sum;arg.gradesystem=S1|S2) |
|
Semister 2 Total |
^(*powerquery;query=com.powerschool.common.dat.gradescoresum;fields=gradepercent2sum;arg.gradesystem=S1|S2) |
|
Final Marks |
~(*powerquery;query=com.powerschool.common.dat.gradescoresum;fields=yearlyavg;arg.gradesystem=S1|S2) |
|
Grade |
^(*powerquery;query=com.powerschool.common.dat.gpagrade;fields=grade;arg.gradesystem=S1|S2;arg.gradedcid=1;arg.percent=^(*powerquery;query=com.powerschool.common.dat.gradescoresum;fields=yearlypercent;arg.gradesystem=S1|S2)) |
|
GPA |
^(*powerquery;query=com.powerschool.common.dat.gpagrade;fields=gpa;arg.gradesystem=S1|S2|S3;arg.gradedcid=1;arg.percent=^(*powerquery;query=com.powerschool.common.dat.gradescoresum;fields=yearlypercent;arg.gradesystem=S1|S2)) |
|
Credits |
^(*powerquery;query=com.powerschool.common.dat.gradescoresum;fields=credithoursesum;arg.gradesystem=S1|S2) |
4. Finalization and Formatting
-
Grading Legend: Manually add text objects to explain letter grades (A, B, C, etc.) with percentage ranges.
-
Footer Section: Add school-specific elements, such as the school stamp, principal’s name, and signature. Use Power Query DATs like ~([39]principal) for dynamic data filling.
5. Preview and Export
Once your report is built, preview the output for a few students to ensure the data displays correctly and the formatting meets your expectations. After any necessary adjustments, you can export or print the report cards as needed.
Summary
To create a report card system using PowerSchool’s Power Query DATs and Object Reports:
-
Extract data using DATs.
-
Design the report layout using Object Reports.
-
Format and customize the report to meet school standards.
This approach generates detailed and accurate report cards for all students.