
Student Standards Progress
The Standards Progress page shows the student's standards grades for each standard that was assessed by reporting term. The column that corresponds to the selected reporting term is highlighted. Compare the grades the student received in each term to assess their progress.
- On the main navigation menu, choose Students.
- Locate the specific student and then select Standards Progress.
- Click a cell to display the standards summary information and the Score Inspector. Grades are highlighted when they are changed.
- The Professional Judgment Indicator alerts you that a student's calculated grade may not align with their proficiency in the standard.
- Click Save.
- To display the assignments used to assess the standard, click the icon in the Assignments column. Use the graph to analyze how the student performed on the standard.
- To display the student's performance on additional standards, select a standard from the Quick Menu.
Student Standards Progress Graph
The standards progress graph displays student performance on the standard.
For example, if the standard was assessed on five assignments, all five standards scores the student received are displayed. If the calculation method is set to the three most recent scores, those scores are indicated in green on the graph. The dotted line on the graph represents the calculated score.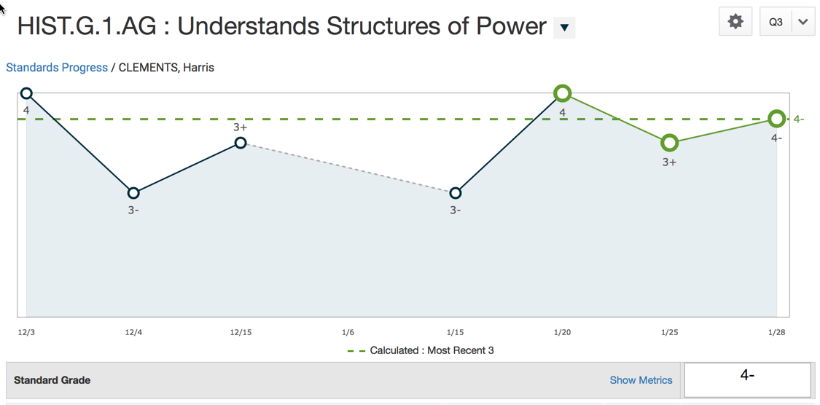
If you select a higher-level standard, that standard and up to three of the directly associated lower-level standards will display. If you chose a lower-level standard, only that standard displays by default.
In the Standard Grade area, you can opt to display or hide a summary of the standards metrics, including:
- Most Recent X – The weighted average of the most recent standard scores where X is the number of scores defined in the Standard Grade Calculations (under Settings)
- Mean – The average of the standard scores
- Median – The middle of the standard scores (half of the scores are higher than this number and half are lower)
- Mode – The most common standard score achieved. In the event of multiple modes, PowerTeacher Pro selects the highest value.
- Wt. Mean – The average of the standard scores based weighted by assignment total value (points possible x weight).
- Highest – The highest standard score
These statistical values indicate how successfully the student mastered a specific standard. If any of the values are low, it may indicate that the student needs additional practice on the skill or concept, or you may want to revise the assignment.
In the summary area, select Show More to display further details of the assignment or standard.
Change the Standard View
Use the Quick Menu to change to a different standard.
Graph Additional Metrics or Standards
- Click the gear icon, then choose Progress Options.
- Choose a metric.
- Select the standards you want to graph to compare multiple standards. You can select a maximum of three standards to graph in addition to the currently selected standard.
- Click OK.
- On the graph page, select the standard grade.
- If multiple graphs are displayed on the page, choose to display or hide the additional standard graphs.
Change a Score
- Select a score on the graph. Alternatively, you can choose a Standard Score.
- Change the score using the Score Inspector as needed. A triangle displays in the grade field to indicate the grade has been manually changed.
- Click Save.