
Traditional Grades Progress
The Traditional Grades Progress graph displays the distribution of grades for the class for the selected reporting term. It also displays the aggregate totals for missing, late, or incomplete assignments, as well as grade scale information.
The page provides a graphical representation of the grade distribution across the selected class.
The demarcation line indicates the cutoff between passing and failing grades.
- From the main navigation menu, choose Progress, then Traditional.
- If necessary, use the class selector to select a different class, or to select a class group.
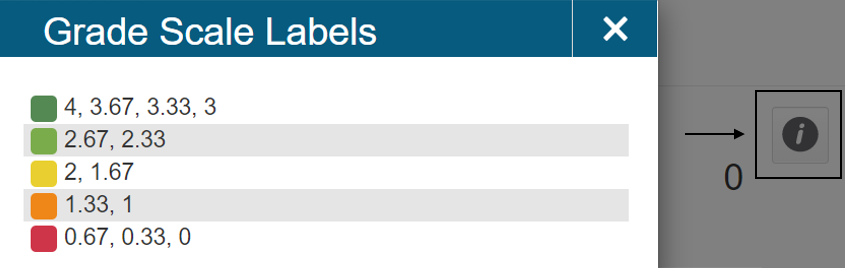
- Click the information icon to review details for the associated grade scale.
- Click View All to display the Traditional Grades Distribution. Students who have a custom grade scale association are indicated by a triangle in the corner of the student name field.
- Click the gear icon. Select or clear Show Trend to show or hide the trend column. Select the term you want to compare against.
- Click a Grade Distribution graph to display the final grades and trend comparison. Arrows indicate if the grades are trending up or down against the selected comparison term.
- Click OK to close the page.
- Click Missing, Late, or Incomplete to display the Traditional Grades page with summary information on each category.